Solution is not something that is desired. It is something that is derived. The key lies in being performance-based rather than solution-based. At HealXRlabs, we act but after gaining an insight. We do not just generate websites but generate businesses as well. Lead conversions are what we specialize in.
Yes, a response that gives returns. It is through our expertise in the sphere of analytics that we have been successful in monetizing the traffic and user experience. We conduct in-depth analysis and based on the results do various post-launch changes in the website so as to make it up to its mark and give a boost to the business. Website is meant for people. For any product to become hit amongst the masses it is necessary to know the consumer behavior.
We go extra mile to study our audience through analytics so as to take usability testing altogether to a new level. Now, usability testing and analytics go hand-in-hand. But what exactly analytics is? What all it covers? How far does it go in usability testing? Read on…
Usability testing and Analytics make for a super duo as it helps to study our users, know their choices, determine the targets and fix the unforeseen issues. Analytics is a powerful tool when it comes to troubleshooting problems as it can ascertain the areas that are causing troubles as well determine the important components of usability testing.
It gives a thorough insight of the consumer behavior and the preferences they have. Thus, these testing tactics go a long way to undergo effective modifications that is purely user-centric in approach. Every website is made with a purpose and analytics prove how far the purpose has been accomplished. It shows how well the website is going with the users.
Are they acting as per the functionality? Analytics highlights the usage patterns just as it is; absolute and fair. In a crux, analytics helps to point out the troubles with the website, depict the user flow on the page and evaluate the progress based on design modifications.
Detecting Troublesome Pages and Parts
For any website, a UX specialist must get down to brass tacks and that is where analytics steps in. Even by evaluating the number of visitors on the website and the most visited pages one can know the pattern in which the users are proceeding on within the page. This determines the user flow on the website.
Further, analytics can prove beneficial in recognizing the problematic sections and pages, which somehow can be tackled by focusing on the issue that is causing the whole disruption. Analytics works on the troublesome issues by measuring the problem according to three standards namely-
- Bounce and Exit Rate
- Average Time on Page
- Page Value
Bounce and Exit Rate
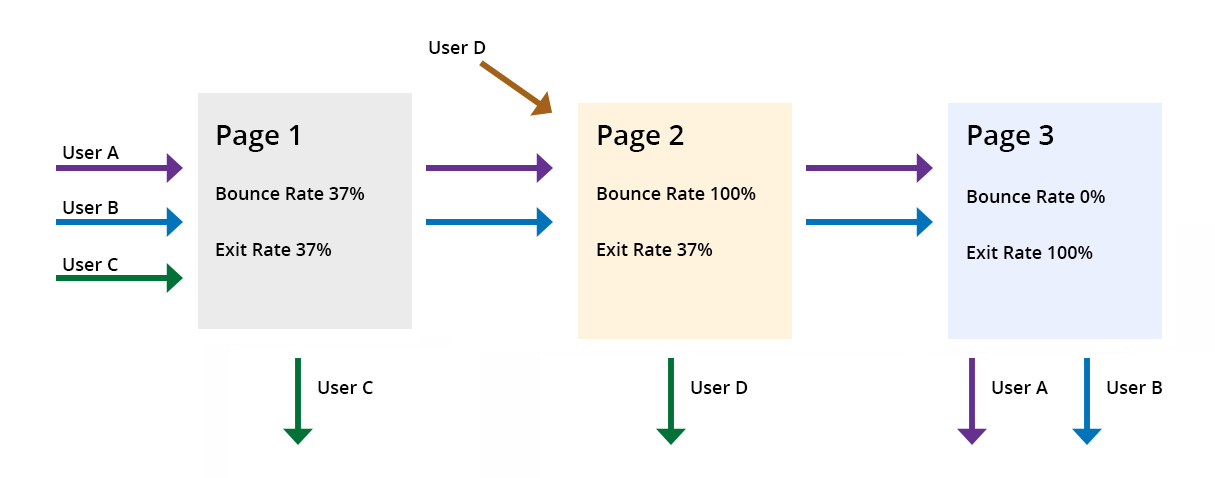
Bounce rate and exit rate are different terms in terms of visitors’ ratio and should not be mingled. Users those who are concerned with just a particular page and leave the website without even considering or going through other pages account to bounce rate. Exit rate, on the other hand, amounts to those visitors who exit the website from a page, but also includes the sum of users who have viewed other pages of the respective website before.
High bounce or exit rates require immediate action so as to terminate the root cause that is pulling away the users from the website. Too much bounce rate is indicative of the fact that the information on the page was not as per the suitability of the user and did not satisfy the expectation with which he opted for the particular website.
Large exit rate figures mean that the visitor is losing interest midway through his search mainly because of this page, but if it happens to be the last page in his search process then the exit rate is not an issue. Google Analytics provides various tools that take in charge of the bounce rates. One such tool is ‘weighted sort’ that reports the proportions in terms of importance rather than number.
It determines various contexts in which the figures are to be considered. Whether majority of the visitors are leaving the website as soon as they enter or no one visited the page, such problems are dealt with as per prevalent situations and thus usability testing methods are also framed accordingly.
Average Time on Page
Typical time implies the amount of time spent by the people on a webpage on average basis. If the amount spent by the users goes under the average standards then it can be deduced that the page is not able to retain the audience for longer durations. On the contrary, if the visitors are devoting too much time on a checkout page, it implies that the page is complex and there has been a problem with understanding the content. But having said that, it all depends upon the information on the page as well, as in the case of blogs and notes, large time figures means great readership and likable articles.
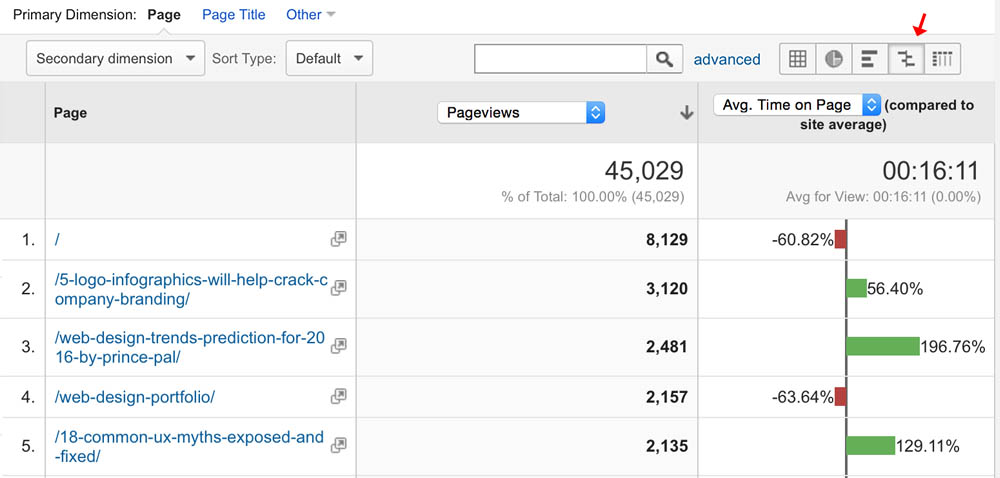
Additionally, performance can also be judged by using ‘compare to site average’ tool present in the menu. The resulting graph will display whether the time devoted on the page is more or less than the fixed average time. However, this cannot be the rule of thumb here as each page has to be assessed differently depending upon its purpose and content. It is then the pages with less than the typical time spent should be taken into notice and changed so as to keep the readers for a longer time. Context surely plays a role, for instance, ‘get a quote’ page will report less time as compared to the ‘blog’ page.
Page Value
A parameter which is sharp yet not widely used for assessing ineffective pages is page value. This metric consists of a price given to a particular web page and it is through this value that usability is calculated. In case of ecommerce websites, it deals with transaction returns whereas for other websites, target returns is what the primary focus is. Both these criteria are fixed by Google Analytics as per the calculations for the value of the page fixed. Page value when fixed at a high level shows great order of significance with regard to pages. Further such pages can even be emphasized at the time of usability testing.
Pages with high value that record large exit rates should become the major area of concern in terms of improvement. These are the pages that are hindering the process of conversion as people are exiting after having made their mind partially. The pages which are losing customers should be acted upon immediately so as to not deter the leads from the website.
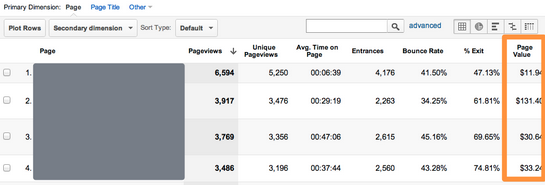
However, pages should not be evaluated on individual basis and considered as a group. The ‘content grouping’ option in Google Analytics will look at the larger picture and consider how all the parts and pages are performing as a group. This feature basically divides the data as per the different category of pages that the users come across in a website. For instance, for website selling lifestyle products, different groups can be made corresponding to different items.
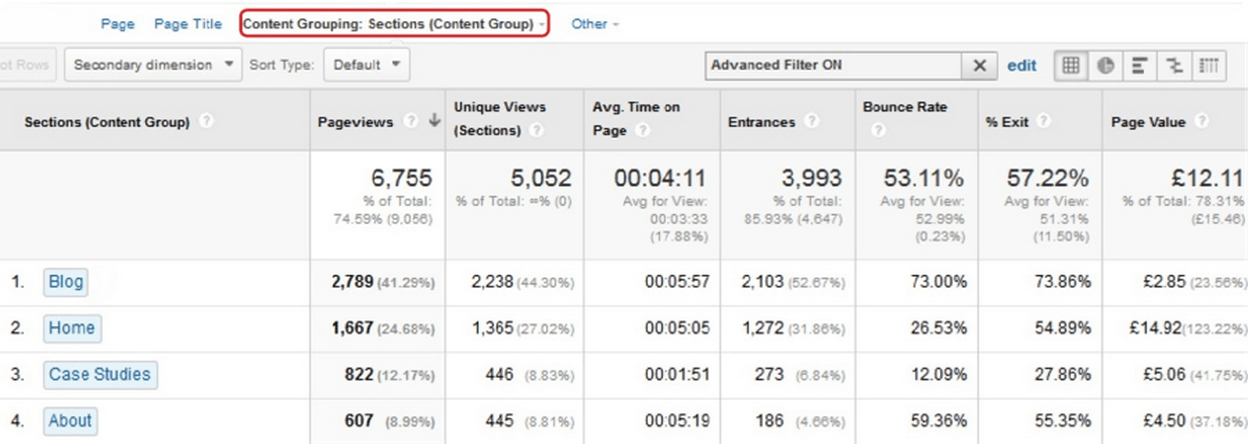
Pages or portions having low page value should be targeted and the reasons for such rates should be treated with solutions. If any section reports low page value, look at the underlying causes for such a ratio. After studying the user response, hints should be gathered as to how to improve the usability of these areas.
How to calculate Page Value?
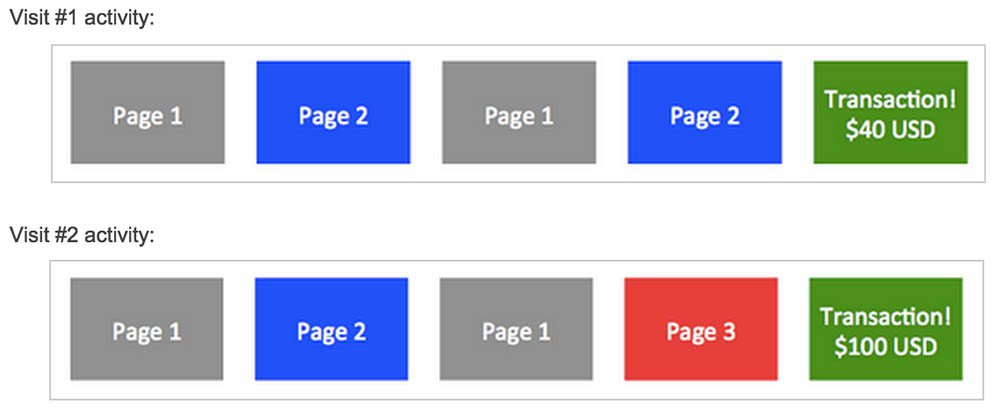
Analytics in Action
Analytics can go a long way in detecting and fixing the aforementioned issues. Look for-
- Identifying the bounce rate so as to know the pages visitors leave as soon as they enter.
- Studying the exit rate so as to judge the halt in the journey of their conversion on the website.
- Comparing the average time on a page by the user to know the interest generated amongst the audience.
- Knowing the value of the page as high ranks amounts to greater usability testing and thus better control on the problems with the page.
Find the Drop – Off Sections
Understanding the user flow across a page can help to evaluate a page in totality. Also, knowing the path a user adopts while exploring a website is quite contributive in the process of usability testing. It gives answers to various questions as to low numbers in conversions. Usability tests usually go parallel to the choices made in the user journeys so that the performance of the users replicates that of the existing members of the website.
If you want to get a clear picture of the user flow as well as the performance through their journey on the website, Google Analytics is the best call. Here too you will have to face some limitations but it will definitely give an overview as to what is the progress of the website. The stats can be difficult to interpret and there can be confusion as the pages are clubbed together in the report. The data for the topmost pages are clear but then the rest of the pages are combined in the >100 pages category which somehow creates an uncertainty in the analysis. By having a limited data on display, each step cannot be tracked properly and grouping can further hinder the information chart that is essential to undergo any changes on the site.
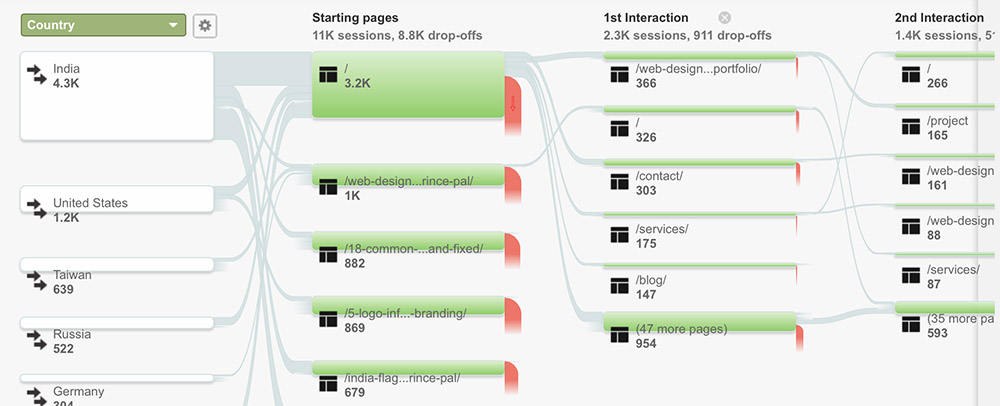
Even though page grouping poses a problem nevertheless it proves useful in detecting the troubles related to drop-off rates or unusual routes that users follow on a website that is a direction that is not expected in their journeys. As soon as the problematic issues are brought to notice, usability tests can be made to learn about the mindset of the visitors, what all they think while visiting the website and the problems they face while going from page to page.
Google Analytics demonstrates the user flow and behavior flow through green boxes which also comprises of grey lines denoting user journeys. Percentages in red pointing towards the drop-offs are a part of the box in the report to inform where the users withdraw from the website. This can clearly inform the patterns from extremes such as favorable user journeys to the exit points present on the website.
Visitors want results. The website will witness greater drop off rates if they do not get what they are expecting. For example, if they are not satisfied with the search results they might jump back to the homepage as vague or unrelated pages will not be able to hold their interest for long. Now, the problem with the search outcomes might be because of no obtainable results or results too large in or even very few in number. Other possible reasons can be unsuitable features such as prices, range and quality etc.
Users are generally simple minded people and do not like to be boggled with too many options. If the search areas are large in extent and difficult for them to grasp they might quit going from the search option altogether out of confusion. Users want something that is crisp and up to the point. So to make them enabled it is better to have advanced search options that can filter and sort the results on a variety of areas so that users do not have to take back the homepage route. By this way they can find the answers which are relevant and not off track. Such an approach will prompt the users to move ahead in their journey rather than going back to the initial step. Improvement in search results can definitely resolve the problem of pogo sticking that is going back and forth between the homepage and search results.
Division that Describes Fine
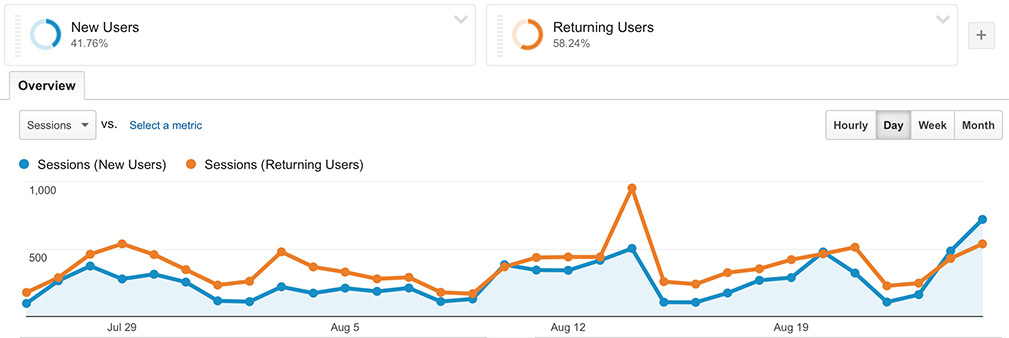
In order to look at the variations in the consumer’s behavior the best way is to segment the data just like making a comparison between the new and the old users. Such differences will help to study the variations in the patterns of their visits, that is, consistency or fluctuations. Such surges or dips can help to derive useful conclusions from the point of view of usability.
Division of data helps to evaluate the finer details to a great extent. It is better to segregate so that other metrics can be used to study the relevant features and thus go for a course of action. By doing an in-depth analysis of the performance and knowing the actions of the users intrinsically it is possible to enhance the usability of a site to a great extent.
By knowing the response of the various categories of the users it is easier to get fruitful lead conversions as well. It is better to stay as real as possible in usability testing so as to get an idea of the exact scenario. Testing by way of different users will help in making the choices associated with user behavior clear. Google Analytics provides various segments that are pre- prepared so as to divide the data and define the useful categories, such as-
- Identifying the traffic sources to track their discovery of the website, through search or through links and other websites.
- Knowing the devices used by the users to check the metrics across various platforms such as mobiles, tablets etc.
Creating standard segments is a wise approach so that these segments can co-relate to the characteristics of the main audience surfing the site. By having set divisions, it is possible to study various user journeys across the website and thus make comparisons of the regular users to the first timers.

Studying the behavior across various devices can bring forth the user behavior and the problems that they are facing. For instance, the drop offs may be high in case of mobile users but this might not be the case in case of a tablet or PC. Thus, segments systematizes usability testing by bringing in focus the right causes and effects which are to be treated for apt solutions.
Streamline Analysis through Analytics
Want your business to rocket? Well, then you need to fire up more so that it takes a flight of success. Let analytics do the combustion. There is a way to go with analytics to get it work in your favor. Here is what you can do-
Setting up Goals and Values
Setting up goals is one of the most important characteristics of Google Analytics. However, this may prove faulty in case of certain websites where the settings do not support it. How far did the conversion rate succeed? This is what goals will report. Be it the number of conversions, the rate of conversion as against a goal or applicable goal value, the reports present a complete coverage.
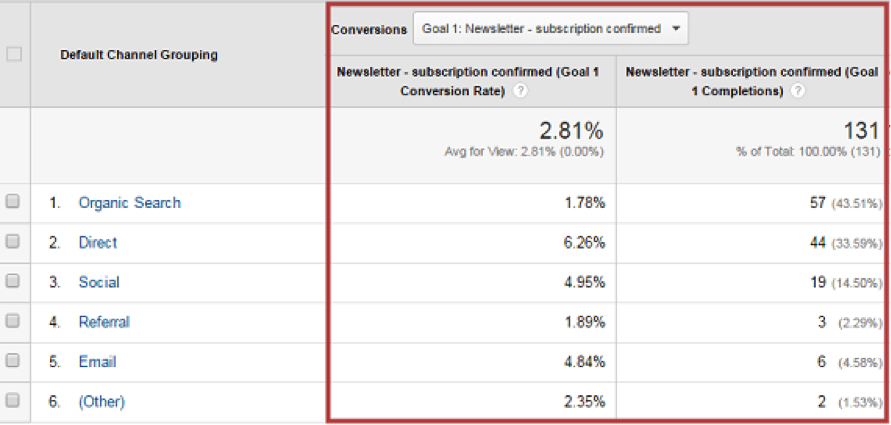
Analytics present a complete report. From acquisition to behavior to conversions, nothing is left. Goals are of two types-micro and macro. It is essential to understand both the types and their requirements. The chief goal that is conversion is what is termed as macro goal. This includes visitor buying products, filling a lead generation form or even fixing for an appointment. It basically consists of the category of main goals in business. Micro goals are kind of secondary goals that do not stand high order of significance. This can be clicking for more information or downloading brochures etc. Micro and macro goals are kind of interrelated and hold a direct link with each other. Advantages of having macro and micro goals include-
- Greater optimization chances as compared to marked primary goals website.
- Different department can be dealt, optimized and examined.
- Development of a multi dimensional approach taking in both macro and micro goals.
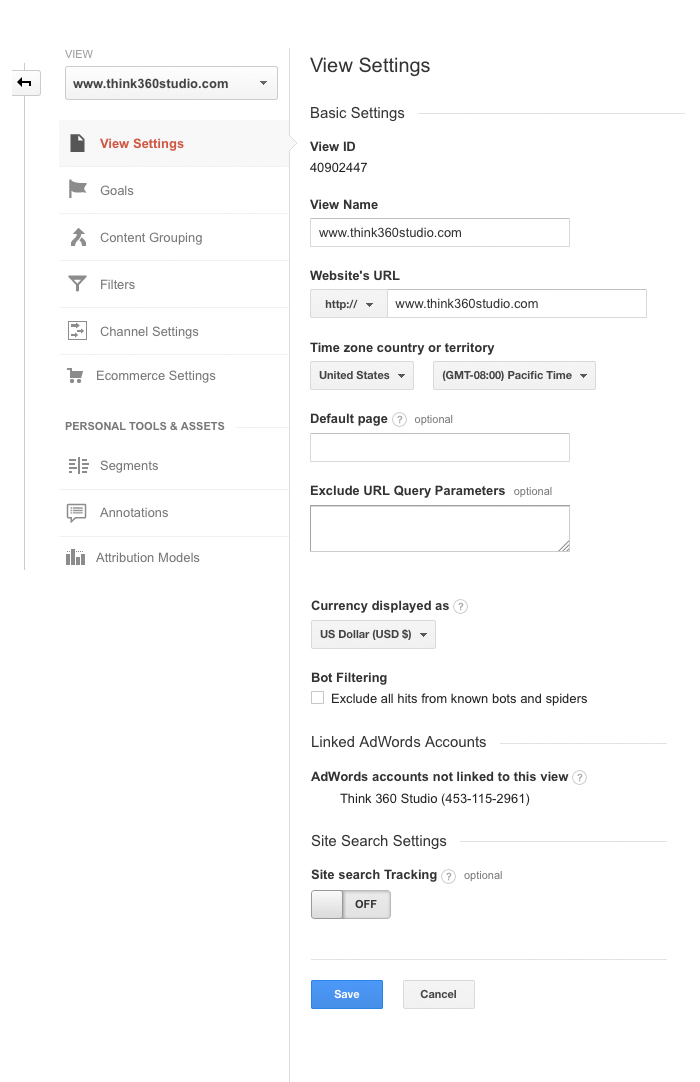
For setting goals, you must be enabled to ‘edit permission rights’ in Google Analytics so as to chalk new goals. Additionally, you are required to state a goal on the View level. After creating a goal you must verify it as per the historical data. Also, if you are unable to determine real values then it is advisable to use relative terms for your goals.

Using Intelligence Events
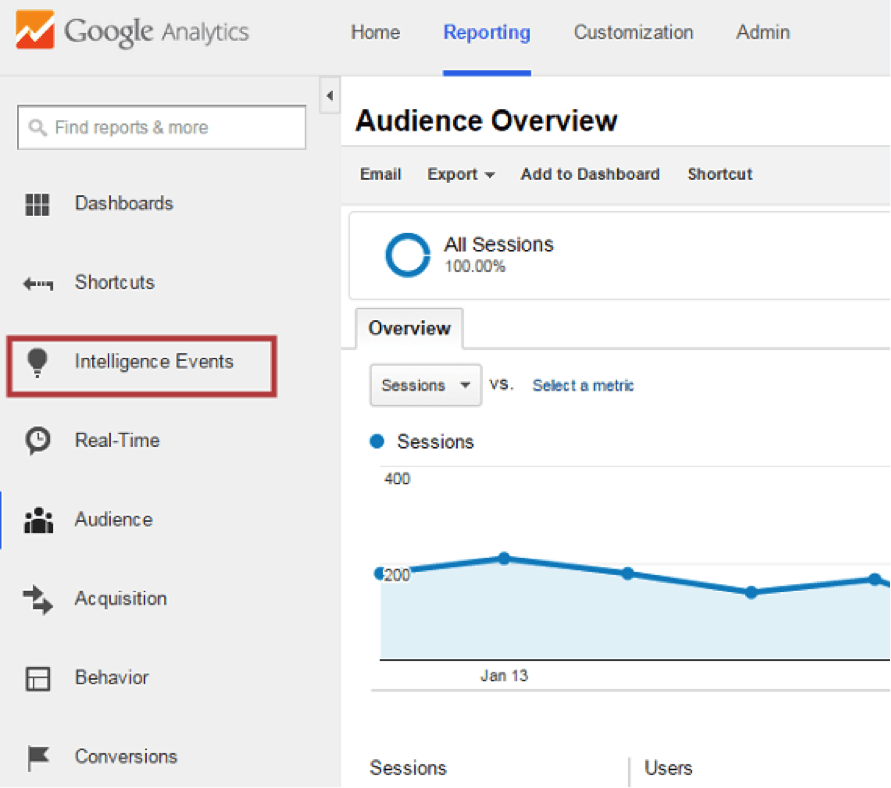
Intelligence events help to derive a better understanding. It gives a better direction and a clear path in terms of analysis. Intelligence events are data-centric suggestions given by Google Analytics that helps in knowing the predictable and the unpredictable type in data. Reporting interface consists of the intelligence events option in the menu. Google Analytics segregates the intelligence events in two types namely automatic alerts and custom alerts. The alerts made for your benefit are the automatic alerts and the alerts that are fixed by us are custom alerts.
Custom alerts can be created at the admin interface which can be located under the Personal tools and Assets menu. For alerts there are various essential items that have to be fixed, which are alert name; mostly a name that is suitable to the memory, apply to; choose reporting views here, period; set the duration. Further, email alert and mobile phone alert (only for United States) and applies to have to be fixed to enable many people accessibility and also, alert condition to ensure the right time for the alert. It is better to go for custom alerts namely- traffic level, macro conversion level, macro conversion rate level as these are quite essential from Analytics point of view.
By Default Reporting of Analytics
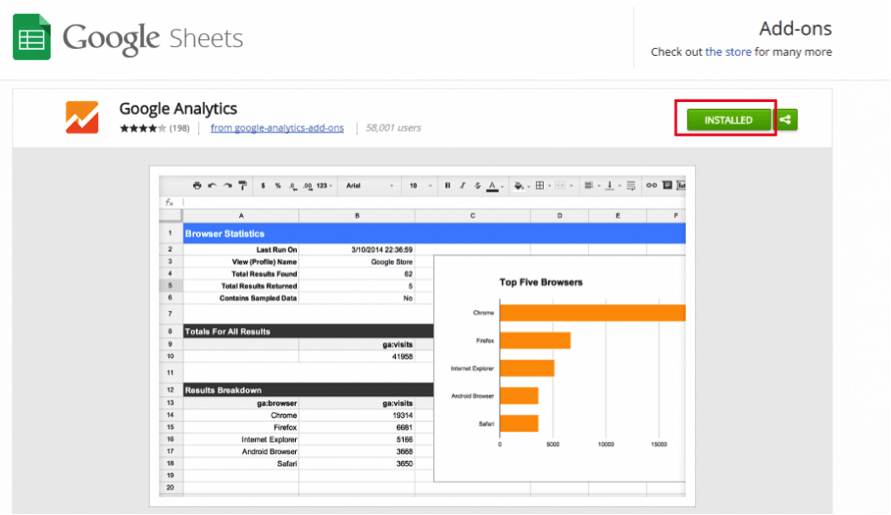
Reports can keep a good track on the business. But it is quite comprehensive on manual lines. It is better to automate all the results through reports so as to save large amount of time and effort. If you are looking for exporting complicated data issues, Google Sheets Add-on can be of great help. It is free and serves the purpose of queries to a large extent. Firstly, install Google Analytics Add-on to Google Sheets and then get started on creating your first report.
You are required to give some data on metrics and dimensions of your preference. Further, fill in the details regarding report name, analytics account name and property name, view name and lastly provide figures for one or more metrics and dimensions. After settling in for a report name, you can give the run command for the final report. Do remember to mark your reports for updates.
1. Add the Google Analytics Add-on to Google Sheets (in my case, it is already installed).
2. Create your first report.
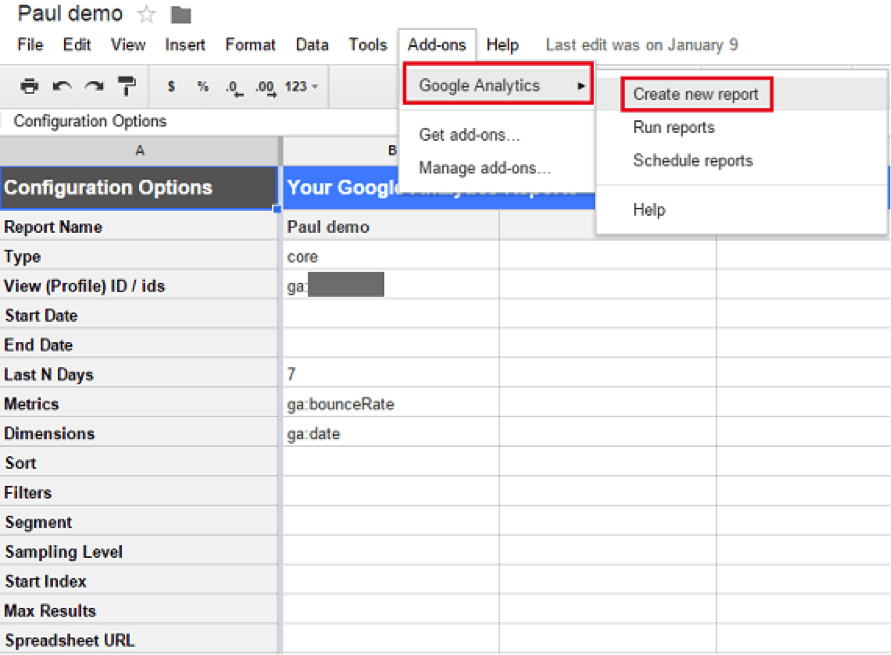
3. Fill in some basic information, including metrics and dimensions you like to work with.
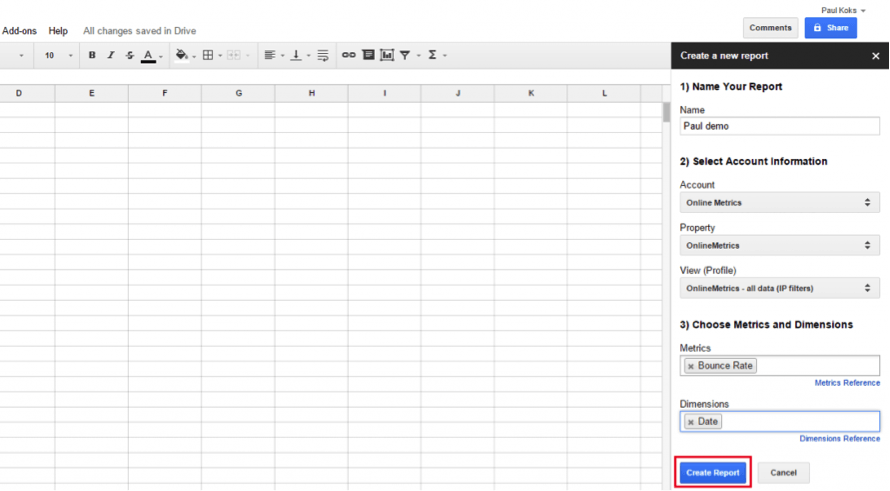
4. Add a report name and hit Run reports on the next screen.
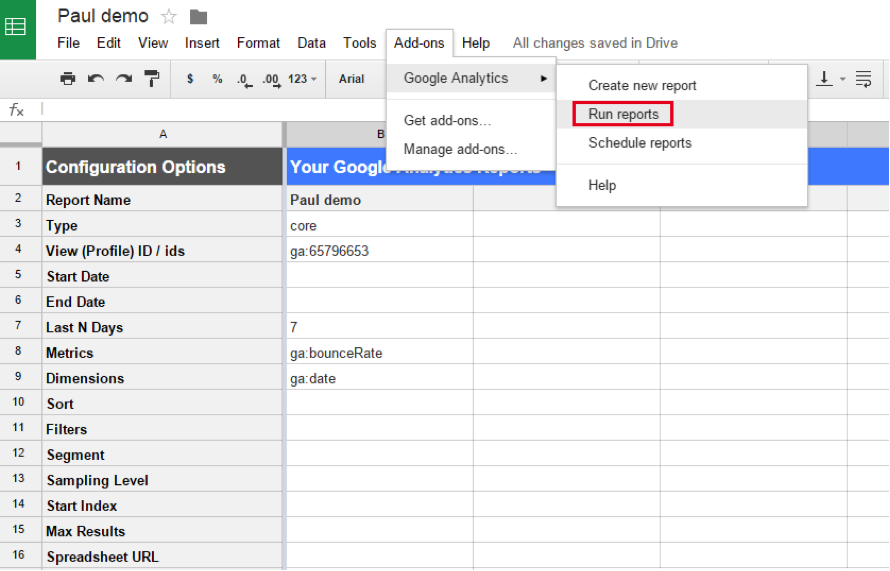
5. And, your report is right here!
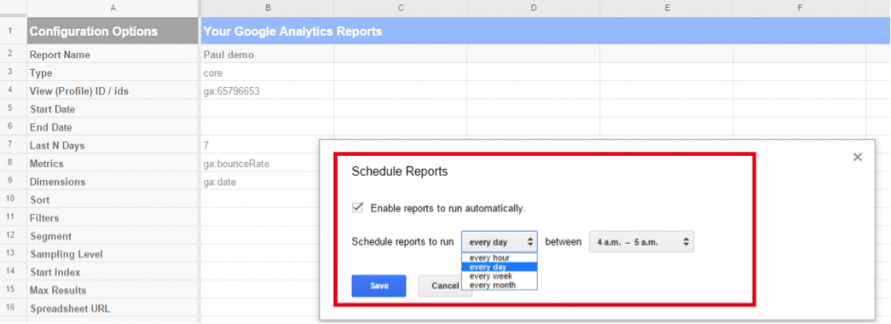
Track the Ecommerce Stats
If we want to know where the business is heading, we need to know the source of its loyal customers as these are the ones who result in profit margins. By having the e-commerce tracking option in Google Analytics, we can find the way of the profitable users and even use it for opening the path for the potential customers. Almost all the reports in Google Analytics can be shifted to the e-commerce version so as to make the maximum monetary benefits. So, above all, e-commerce tracking is a feature in Google Analytics that is a must have.
However, this is not applicable if the users are not making any transactions on the websites. To enable e-commerce tracking, click admin option at the topmost right in Google Analytics standard reports. Further, select eCommerce settings in profile settings and change the drop down option to yes, eCommerce site. Do apply and you are good to go.
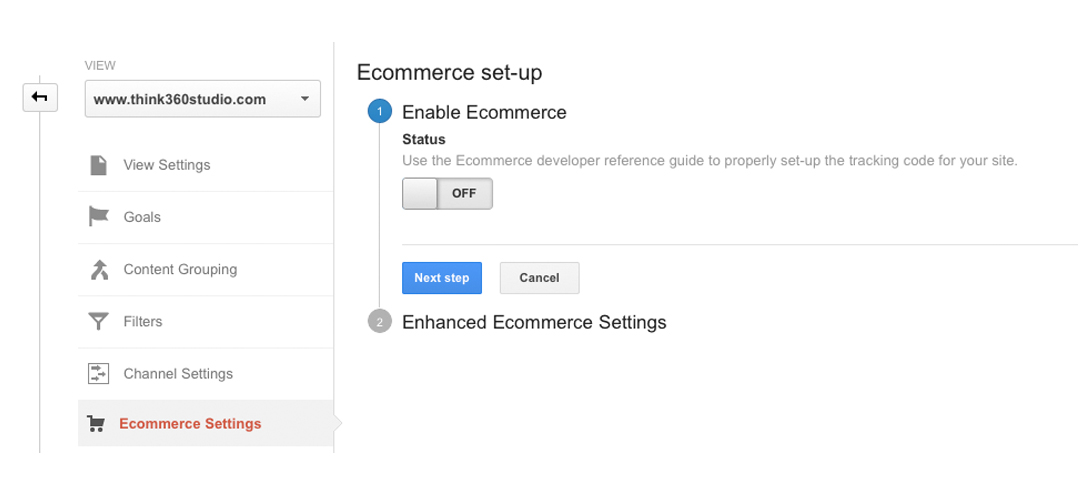
Unfortunately, this isn’t as simple as it looks. Connecting the e-commerce segment of the website to Google Analytics and transporting all the significant information regarding purchases and the prices is complex. You will definitely need the help of a proficient developer or coding expert to get your way through this. If the website is built on the right track then it is possible to avoid all the complications. Link the website to Shopify and it will automatically send all the e-commerce details to Google Analytics.
For this, you need to provide Shopify with the Google Analytics ID and set the ecommerce tracking option on. Furthermore, WordPress plugins like Cart66 can also do the needful. Here too you need to give in your property ID, set the eCommerce option on and you can check what all is the progress. It is important to link the eCommerce options with Analytics so make sure it is not faulty. Now, if you are wondering if Paypal stands a chance here and works compatible then the answer is No. If seems to pose problems and does not support the eCommerce tracking techniques.
Check through Site Search
Want your site to be a hit? Then you need to know the missing links of what is still not present there and this can be done through internal site search option in Google Analytics. It will give a detailed record of the keywords people use to search something on the website. This will help you track what all needs to be added on the site and also how to fix the troubles related to search faced by the users. For selecting site search, go in the Google Analytics standard reports and select the admin button on the topmost right.
Click on the site search settings in profile settings option and further enable ‘do track site search’. You must know the procedure of recognition of internal search terms in the website. This happens mainly with the help of query parameter, so keep in mind that Google Analytics selects the same query parameter and marks them as internal search items. In order to find the search query parameter, look at the URL present on the search results page and here you can find your search term.
Master with Google Webmaster
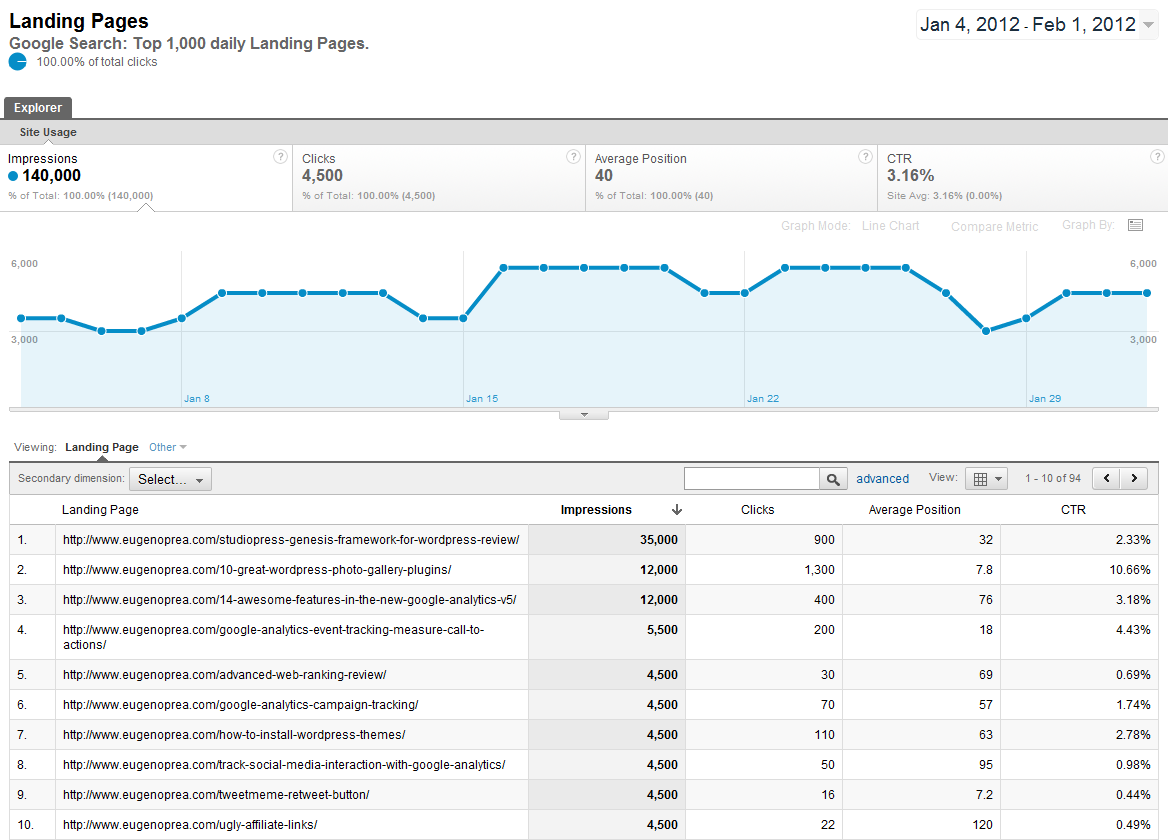
Google Analytics consist of another tool –Webmaster which will enable you to see the figures relating to search queries and also view the standings on Google. It also diagnosis the information put forth by Google as well as analyzes the number of links to the website. Also, it assists in assessing +1 metrics, checks the customers’ actions and even gives a sitemap for Google to register. Connecting the Webmaster with Google Analytics optimizes the reports as per the search engine. After linking, we can view three new reports in the Google Analytics account namely Queries, Landing Pages and Geographical Summary. This will broaden the horizon on the keywords related to the search queries and the ultimate landing pages of the users. Thus it can be used to recognize-
- Average positioned keywords even though going at a low response rate. At detecting them, changes in meta title and information can be made so as to increase the rate of performance.
- Landing pages which record nice click rates but are positioned below average. Such pages can be made to undergo optimization procedure so as to improve the page performance.
- The countries of the loyal visitors and the type of target market.
In order to link the Google Webmaster with Analytics you need to select the traffic sources section and click on search engine optimization to get one of the three reports. Here you will view the benefits display and a button which gives you the option of selecting webmaster tools data. Click this option and select edit from webmaster tools settings. After that the page will be redirected to the Google Webmaster Tools wherein you can link it with Google Analytics.
Set up Site Speed
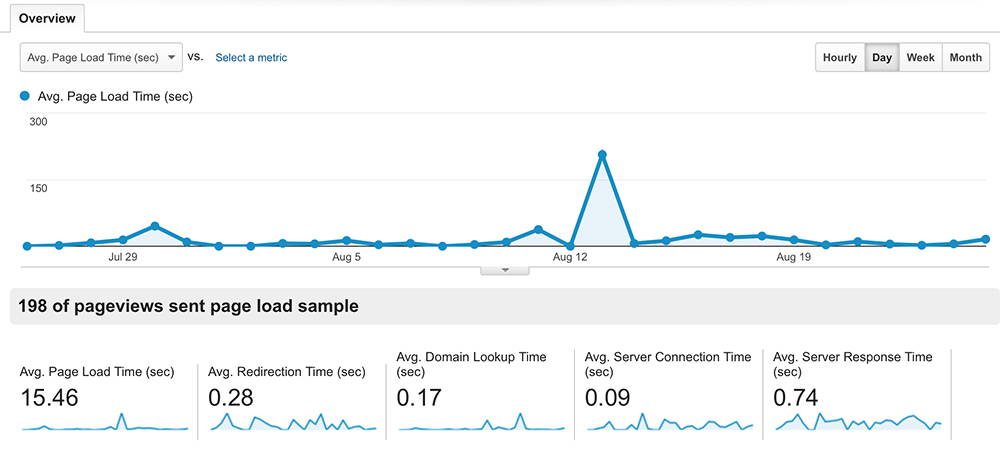
You need to know the load time of the pages on the website so as to analyze the time factor. Site speed in Google Analytics will bring to notice those pages which are creating a problem and thus take the necessary action to quicken the load time. Load time does play a significant role as it can affect the consumer behavior and thereby result in enhanced user experience. The increased satisfaction will also result in improving the page rankings.
So, besides page views and bounce rate, one can also view the average page load time and the amount of visits by the consumers helpful by way of collecting data for studying the sample of every page. Further, the performance tab can show different stages in page load time and even tell average load speed of these pages. Earlier, additional codes had to be added in Google Analytics tracking, but now the data is added by default in the reports.
Tab through Track Events
Google Analytics consists of a powerful tool of event tracking that helps to track various aspects such as number of eBook downloads, the ads scoring well and the users clicking on these ads, the type of signup forms favorable amongst the consumers, categories of consumer playing or halting a video and the errors faced by the users at the time of checkout. In addition to this, Google Analytics in its latest version marks events as goals that can be used to judge the performance based on the fixed standards.
Event tracking just involves some coding and you are all set. This coding includes mentioning default items namely- category (for what to track), action (for mode used by the user), label (for the type of event) and value (for fixing a goal for the event). After the links have been formed then you need to set up the event as a goal and that can be done through category, action, label and value options.
![]()
Advance with Real-Time Reporting
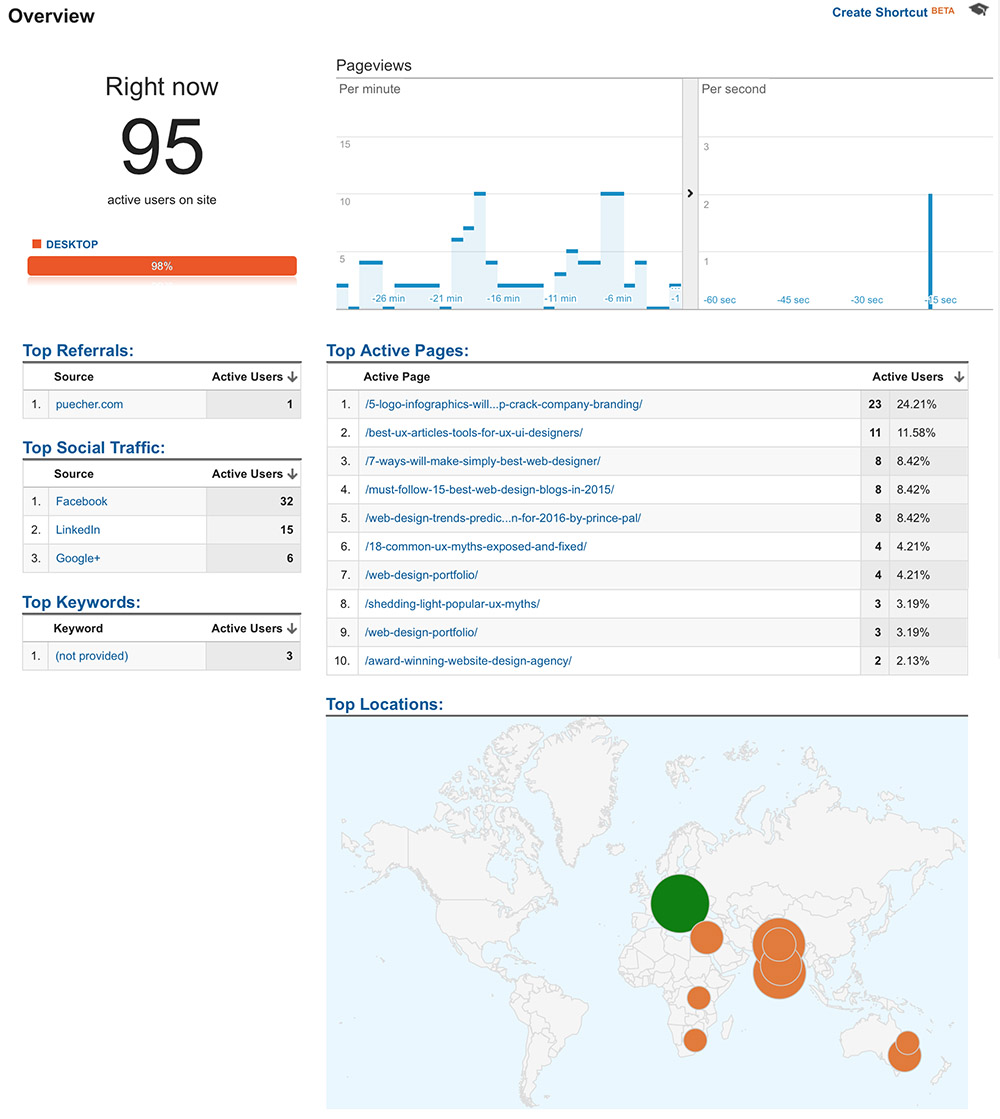
Real-time reporting has revolutionized Google Analytics tremendously as it reports information about the users that are present on the website at a particular time. Additionally, you can know about their location on the site, their source, mainly, keywords and the country they reside in. Further, three reports can also be obtained that gives a detailed account of the place they come from, the way they found the website and the category of pages they visited. Real-time reports can be viewed by going to the real-time (beta) option in the menu bar.
By selecting the report display, you can see locations report that tells about the number of visitors and the countries they reside in, also, providing a sitemap. Also, traffic sources report will tell about the source of traffic and the means they use to access as well as the grand total of the visitors on the site. Lastly, the content report will inform about the active pages that are preferred by the users and the number of these active pages.
Conclusion
What better way to know your users than Google Analytics? Using these insights we can organize our account and create a great marketing funnel. Besides knowing the traffic and how users interact, Analytics is useful as it helps to enhance the conversion rates by way of changes required for the improvement of website. Analytics go a great way in maximizing the usability as it creates a good bridge towards assessing their performance and understanding their preferences. By way of tracking and optimizing, the percentage ratio of lead generations can be enhanced thereby providing top-line revenue through these channels. Our team at HealXRlabs works hard towards identifying the channels that can contribute to the growth of your business. We monitor to monetize. By knowing the nitty gritty of Analytics and user testing, we make the website in sync with the user behavior. Want to increase website traffic? Want more lead conversions? Want to make a killing? Let us set the pace with our super experience in Google Analytics.
